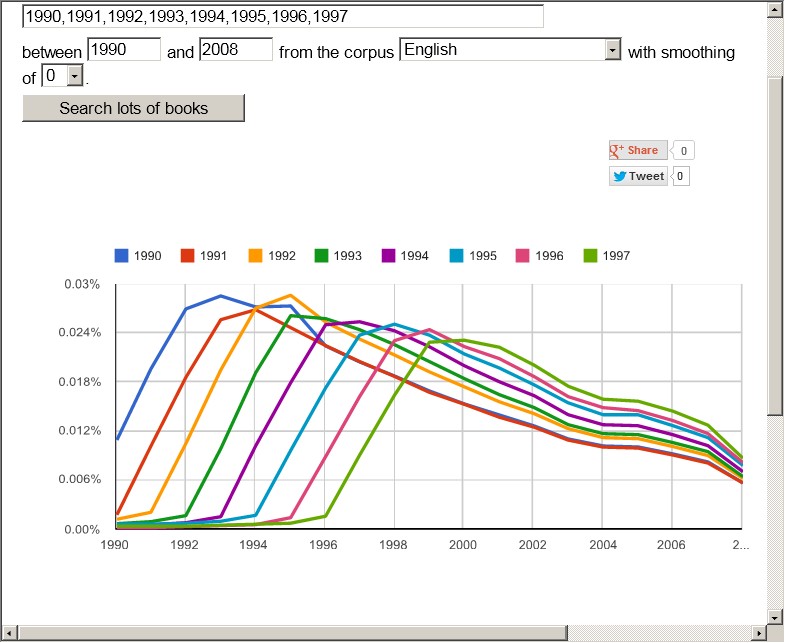
you'd expect. Growing mentions as the year approaches and continuing to
rise to a peak a couple of years later when (for example) a book about events
in 1993 actually gets written and published. It's the right-hand side that bothers
me. Notice the kinks at 2005 and 2007. After these points, it looks like
references to all 8 of the years started a simultaneous decline???
http://books.google.com/ngrams/graph?content=1990%2C1991%2C1992%2C1993%2C1994%2C1995%2C1996%2C1997&year_start=1990&year_end=2008&corpus=15&smoothing=0&share=
No comments:
Post a Comment